At the heart of your investing strategies is an acronym that you’ve heard often but perhaps haven’t fully understood – MACD. Now, imagine if you had a reliable key to unlocking those stock market trends and patterns, wouldn’t that be a game-changer? That’s precisely what MACD, or Moving Average Convergence Divergence, offers. This tried-and-tested tool allows you as an investor to have a clearer understanding of where a specific asset price can potentially go, signaling your best move to buy or sell.

Definition of MACD
MACD, which stands for Moving Average Convergence Divergence, is a popular tool used in technical analysis. It’s used to identify potential buy and sell signals and to gain a better understanding of the market’s momentum and direction.
Understanding MACD
You can see MACD as a trend-following and momentum indicator that illustrates the relationship between two moving averages of an asset’s price. It works based on the principle that in any given market, momentum usually changes before the price. Therefore, MACD aims to capture this early shift in momentum to help traders take advantage of potential price changes.
Origins and calculation of MACD
MACD was developed by Gerald Appel in the late 1970s. The calculation of MACD involves subtracting the 26-day Exponential Moving Average (EMA) from the 12-day EMA. The result is the MACD line. A nine-day EMA, often referred to as the ‘signal line’, is then plotted on top of the MACD line to function as a trigger for buy and sell signals.
Essential elements of MACD
The MACD is composed of three components: the MACD line, the signal line, and the MACD histogram. Each of these elements plays a crucial role in interpreting and using the MACD in a trading strategy.
Understanding the MACD Line
Concept of MACD Line
The MACD line is a reflection of the difference between the 12-day EMA and the 26-day EMA. It is crucial for understanding the asset’s short-term momentum compared to the long-term momentum.
Interpretation of the MACD line
A rising MACD line suggests that the short-term momentum is outpacing the long-term momentum, which could indicate a bullish market trend. Conversely, a falling MACD line could signify a bearish trend, implying the short-term momentum is slowing compared to the long-term.
Influence of MACD line on trading strategy
The MACD line can significantly influence your trading strategy. An increasing MACD line may hint at a good time to buy, indicating that the asset’s momentum may continue to rise. On the other hand, a decreasing MACD line might suggest a good time to sell. However, using the MACD line in isolation can lead to misleading signals, thus it’s best to confirm with other indicators.
Understanding Signal Line in MACD
Definition of Signal Line
The signal line in MACD is a nine-day EMA of the MACD line. It serves as a signal point for bullish and bearish markets.
Role of the Signal Line
The signal line acts as a trigger for potential trading opportunities. When the MACD line crosses above the signal line, it creates a bullish signal, indicating it may be time to buy. Conversely, when the MACD line crosses below the signal line, it gives a bearish signal, which could be a good time to sell.
Relevance of Signal lines to traders
For traders, signal lines are crucial as they can provide potential trading signals. The crossover of MACD and signal lines can help traders identify the right time to enter or exit a trade.
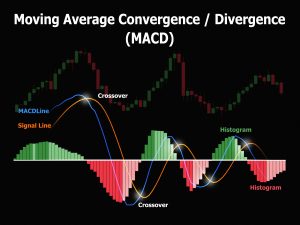
Significance of the Histogram in MACD
What is a MACD Histogram?
The MACD histogram visually represents the difference between the MACD line and the signal line. It oscillates above and below the zero line as the MACD and signal lines cross each other.
Interpreting the Histogram
When the histogram is above the zero line and rising, it suggests that the momentum is strong and the upward trend is likely to continue. Conversely, when the histogram is below the zero line and falling, it indicates a bearish trend.
How Histogram helps in trading decisions
The MACD histogram can help traders visualize changes in the strength, direction, momentum, and duration of a trend in an asset’s price. Along with the other components of the MACD, it can aid in making informed trading decisions.
MACD Zero Line
Understanding MACD Zero Line
The MACD zero line is the point where the values of the two moving averages that make up the MACD line are equal. When the MACD line crosses above or below this line, it signals changes in the trend.
Impact of Zero Line Crossovers
Zero line crossovers can indicate significant trend changes. A bullish crossover occurs when the MACD line crosses above the zero line, indicating a potential upward price trend. Conversely, a bearish crossover occurs when the MACD line crosses below the zero line, signaling a potential downward price trend.
Zero Line as a signal of market trend
Historically, many traders consider the zero line as an area of support and resistance. This makes it an important factor in identifying the market trend at any given moment.
Using MACD for Buy and Sell Signals
Identifying Positive and Negative Divergences
In using the MACD, it’s important to watch for positive and negative divergences, which can hint at potential price reversals. Positive divergence occurs when the price of an asset is in a downtrend but the MACD is showing an uptrend, suggesting a potential upward price reversal. Negative divergence, on the other hand, occurs when the price is in an uptrend but the MACD is in a downtrend, indicating a potential downward price reversal.
Crossover strategy with MACD
One of the most common strategies when using MACD is referred to as a ‘crossover’. This involves buying when the MACD line crosses above the signal line (bullish signal) and selling when it crosses below (bearish signal).
Common pitfalls and misinterpretations
However, it’s important to be aware of common pitfalls and mistakes when using MACD. One common mistake is to rely solely on the MACD for trading decisions. Although MACD can be a powerful tool, it is most effective when combined with other technical indicators. Moreover, the MACD can sometimes give false signals, recommending buy or sell opportunities that don’t bring good results.
The Impact of MACD Settings on Trading
Default settings of MACD
The default MACD settings are 12 for the fast line, 26 for the slow line, and 9 for the signal line. These settings aim to capture the short and medium-term trends in the market.
How to adjust MACD settings
Some traders may adjust their MACD settings to suit their personal trading style or risk tolerance. For example, if you prefer a faster response to changes in trend, you might lower the value of the slow line or increase the value of the fast line.
Effects of changing MACD settings on signals
Remember that changing MACD settings can affect the signals you receive. Making the MACD react faster may increase the number of buy and sell signals you get, but it could also increase the number of false signals.
MACD and Other Technical Indicators
Combining MACD with Moving Averages
Combining MACD with moving averages can be highly beneficial as both are trend-following indicators. When the MACD lines cross each other and the price crosses above or below the moving average, the signals to buy or sell can be significantly reinforced.
Using MACD with RSI
Another powerful combination is MACD and Relative Strength Index (RSI). While MACD identifies the trend direction and potential reversals, RSI measures the speed and change of price movements, often signaling overbought or oversold conditions.
Integrating MACD with Bollinger Bands
MACD can also be successfully integrated with Bollinger Bands. Bollinger Bands can provide levels of support and resistance while MACD can confirm buy and sell signals in line with those levels.
Limitations of Using MACD
False signals in MACD
One of the main limitations of MACD is the occurrence of false signals. For instance, a sudden price move can cause the MACD to indicate a trading signal, but this does not always translate into a continued trend.
MACD limitations during sideways trading
MACD may also be less effective in a sideways or non-trending market, as it’s primarily designed to follow trends. In such situations, the MACD can give numerous buy and sell signals that could lead to multiple unsuccessful trades.
Why MACD is not a standalone indicator
Due to these limitations, MACD should not be used as a standalone indicator. It functions best when used in conjunction with other technical analysis tools to confirm trends and signals.
Practical Strategies for MACD
Incorporating MACD into a trading strategy
When incorporating MACD into your trading strategy, it’s essential to use it in conjunction with other technical indicators for signal confirmation. Also, always keep in mind that while the MACD can provide valuable insights about potential trends and reversals, it’s not foolproof.
Mitigating risks using MACD
MACD, used correctly, can also be a helpful tool for mitigating trading risks. By alerting you to potential reversals and helping to confirm the strength of a trend, it can assist you in making calculated trading decisions.
Best practices for using MACD on different timeframes
Like any other technical indicator, the MACD isn’t limited to specific timeframes. However, as a rule of thumb, indicators tend to be more reliable on longer time frames as short-term market noise is eliminated. Therefore, it’s generally advisable to use the MACD on medium to long-term timeframes for a clearer view of the market trends.