It’s time to elevate your game in the investment world and you can start by understanding indicators like RSI (Relative Strength Index). This article will help you become well-versed in this complex yet rewarding field of market analysis. Get ready to uncover key strategies, decode investment jargon, and amplify your understanding on how to accurately use indicators such as RSI in investment, regardless of whether you’re a beginner or an experienced investor fine-tuning your approach. Let’s enhance your investment prowess together!

Understanding What RSI Is
Trading has become a popular way of making money and is often seen as a primary or secondary career option. One popular tool used by traders across the globe is the Relative Strength Index, also known as RSI. Understanding the RSI is fundamental to having a great trading strategy.
Definition of RSI
The Relative Strength Index, or RSI, is a momentum oscillator that measures the speed and change of price movements. Developed by J. Welles Wilder, a renowned technical analyst, this index oscillates between zero and 100. Essentially, it signifies the internal strength of a single security, or index, over a predefined number of trading sessions.
Why Traders Use RSI
RSI is used by traders mainly because it helps to identify overbought and oversold conditions in the market. Traders can use it to find potential reversals in market trends and to evaluate the overall strength of the current trend. RSI is also beneficial for identifying divergence, which happens when the price and RSI are moving in opposite directions.
Understanding RSI Calculation
RSI calculation involves averaging the gains and losses over a specific period, usually 14 trading sessions. The average gain or loss is then divided by the sum of the gain and loss and multiplied by 100. The resulting figure gives the RSI value.
Setting Up RSI on Your Charting Platform
To take advantage of the RSI in your trading strategies, you’ll need to set it up on your charting platform.
Choosing a Charting Platform
A good charting platform should offer a wide range of technical analysis tools, including the RSI. It should provide real-time data, have an intuitive user interface, and support multiple types of charts.
Navigating to RSI Setting
To set up RSI on your charting platform, you would typically look for a menu or icon related to technical indicators or analysis. From there, select RSI from the list of available indicators.
Adjusting the RSI Period
By default, RSI takes into consideration the previous 14 periods. But you can customize the period according to your trading preference. Keep in mind though that decreasing the period can increase the sensitivity of RSI to price changes, leading to more overbought and oversold signals.
Interpreting RSI Value
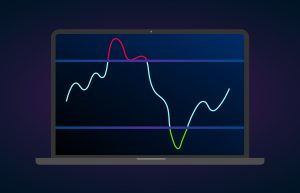
The RSI values range from 0 to 100. A value above 70 signifies overbought situations, while a value below 30 indicates oversold conditions. Thus, traders could identify potential buying and selling opportunities.
Identifying Overbought and Oversold Conditions
Recognizing overbought or oversold conditions can help traders predict potential price reversals.
What Overbought and Oversold Mean
In trading, overbought refers to a situation where the price has risen so much – and usually so quickly – that it surpasses its true value, indicating a potential price correction. On the other hand, oversold implies the exact opposite – the price has dropped so much that it’s now below its true value, hinting at a potential price increase.
RSI Thresholds for Overbought and Oversold
Generally, an RSI reading above 70 suggests that the market may be overbought while reading below 30 signifies that the market may be oversold.
Potential Trading Signals from Overbought and Oversold Conditions
Crossings of these threshold levels can generate potential trading signals. For example, when RSI crosses above 70, it could be a sell signal, and when it crosses below 30, it could be a buy signal. However, these signals should not be used alone without considering other market conditions.

Using RSI for Trend Identification
RSI can also be a helpful tool for understanding market trends.
Understanding Market Trends
A market trend is the direction in which the market is moving. It can be upwards (bullish), downwards (bearish), or sideways (neutral).
How RSI Reflects Trend Strength
The RSI can reflect the strength of the current trend. If prices are rising and the RSI is above 50, this typically indicates an upward trend. Conversely, if prices are falling and the RSI is below 50, this suggests a downward trend.
Trend Reversals and RSI
RSI can also help traders identify trend reversals. For example, if the RSI falls below 30 and then crosses back above 30, it might suggest a trend reversal from bearish to bullish.
Understanding Divergences with RSI
RSI cautions traders of potential price reversals through divergence.
What a Divergence Is
Divergence occurs when the price of a stock and the RSI move in opposite directions. Regular divergence can warn of a potential price reversal; if price reaches a new high, but the RSI doesn’t, it’s a bearish divergence. Conversely, when a price hits a new low but RSI doesn’t, it’s a bullish divergence.
Identifying Divergences on the RSI Chart
Divergences can be identified by drawing a line connecting the high points or low points on the RSI chart and the corresponding points on the price chart and then comparing the direction of the lines.
Trade Signals from Divergences
Bullish divergence could lead to a buy signal, while bearish divergence could result in a sell signal. However, like any other trading signals, divergences can sometimes lead to false signals, so they should be used as one aspect of a complete trading strategy.
Incorporating RSI in a Trading Strategy
Now that we’ve covered the basics of RSI, let’s see how it can be incorporated into your broader trading strategy.
Role of RSI in an Overall Strategy
The RSI can play a valuable role in a trading strategy, helping identify potential entry and exit points. However, like all trading tools, it should not be used in isolation. Always consider the broader market context and other technical indicators.
Complementing RSI with Other Indicators
While RSI is an effective tool for spotting potential reversals, it can be more effective when used in conjunction with other technical indicators. For example, using moving trend lines or volume can provide additional information about market trends and further validate RSI signals.
Managing Risk with RSI
Although RSI can help identify potential trading opportunities, it’s also critical to use risk management strategies when using this tool. This may involve setting stop-loss orders to limit potential losses if the market moves against your position.
Interpreting False Signals and Noise
Just like any other indicator, RSI isn’t immune to false signals and noise, which can lead to misleading interpretations.
Understanding False Signals
False signals occur when the indicator produces a buy or sell signal, but, the expected price move doesn’t materialize. For instance, RSI might signal an overbought condition, but the price could continue to rise.
How Noise Influences RSI
Market noise refers to random or meaningless price fluctuations. This can affect RSI, leading it to generate false signals. For example, sudden price volatility can make the RSI appear overbought or oversold even when it’s not.
Mitigating the Impact of Noise and False Signals
One way to mitigate the impact of noise and false signals is to use longer periods for the RSI. Also, combining RSI with other technical indicators can help validate signals and reduce your risk of acting on false signals.
Advantages and Disadvantages of Using RSI
Like any other trading tool, RSI has its strengths and weaknesses.
Key Benefits of RSI
The key benefits of RSI include its ability to identify potential overbought and oversold conditions, warn of possible reversals through divergences, and reflect the strength of current trends.
Limitations of RSI
While RSI can certainly be valuable, it’s not without its limitations. These include the potential for false signals and its inability to provide target price levels or suggest how long a trend might last.
Common Mistakes To Avoid When Using RSI
To get the most out of the RSI indicator, it’s crucial to avoid some common mistakes.
Overreliance on RSI
RSI should always be used as part of a broader trading strategy. Relying solely on this or any other indicator is a risky strategy that can lead to poor trading decisions and potential losses.
Ignoring the Market Context
It’s essential to take into account the broader market context when interpreting RSI readings. The current market environment might justify an unusually high or low RSI.
Misinterpreting RSI Levels
Just because the RSI is above 70 doesn’t always mean a market is overbought and due for a pullback. Similarly, an RSI below 30 doesn’t guarantee a market bounce. Correctly interpreting RSI levels requires practice and patience.
Practical Examples of Applying RSI
Finally, let’s look at some practical examples of how RSI can be applied.
RSI in Bullish and Bearish Markets
In a bullish market, you might look for instances where the RSI dips below 30 and then crosses back above this threshold as potential buying opportunities. In a bearish market, look for cases where the RSI exceeds 70 and then falls back below it as potential selling opportunities.
Building a Trade based on RSI Signals
To build a trade, first, ensure the RSI is in line with the market trend. For instance, in an upward-trending market, you might look for RSI to dip into oversold territory (below 30) and then cross back above 30 as a potential buying signal. Always confirm this signal with other technical analysis tools before making a trading decision.
Illustrative Examples of RSI Trade Setups
One classic RSI setup involves a divergence between the price and RSI. If the market is making new highs while the RSI fails to reach new highs, this bearish divergence could signal a potential price reversal and a potential selling opportunity. Once again, use other technical analysis tools to confirm this signal before trading.
In conclusion, the Relative Strength Index can be a valuable tool within a broader trading strategy. It can help to identify potential trading opportunities and manage risk. As with all trading tools, it’s essential to practice using RSI and to combine it with other techniques and indicators to create a more fully-rounded trading strategy.


