You’re about to embark on an enlightening journey through the labyrinth of market analyses with a specialized focus on something known as Bollinger Bands. These financial tools, developed by John Bollinger in the 1980s, have become a mainstay in modern trading scenarios. By opening this article, you’ve taken a step towards understanding the nuances of these dynamic volatility indicators and how they can be effectively used to augment your trading prowess.

Understanding Bollinger Bands
As we dive into the world of financial trading, you will come across many terms and strategies. One such tool widely used by traders across multiple markets is the Bollinger Bands. But what are they exactly? Why and how are they used? Let’s get started on your journey to understanding Bollinger Bands!
Definition of Bollinger Bands
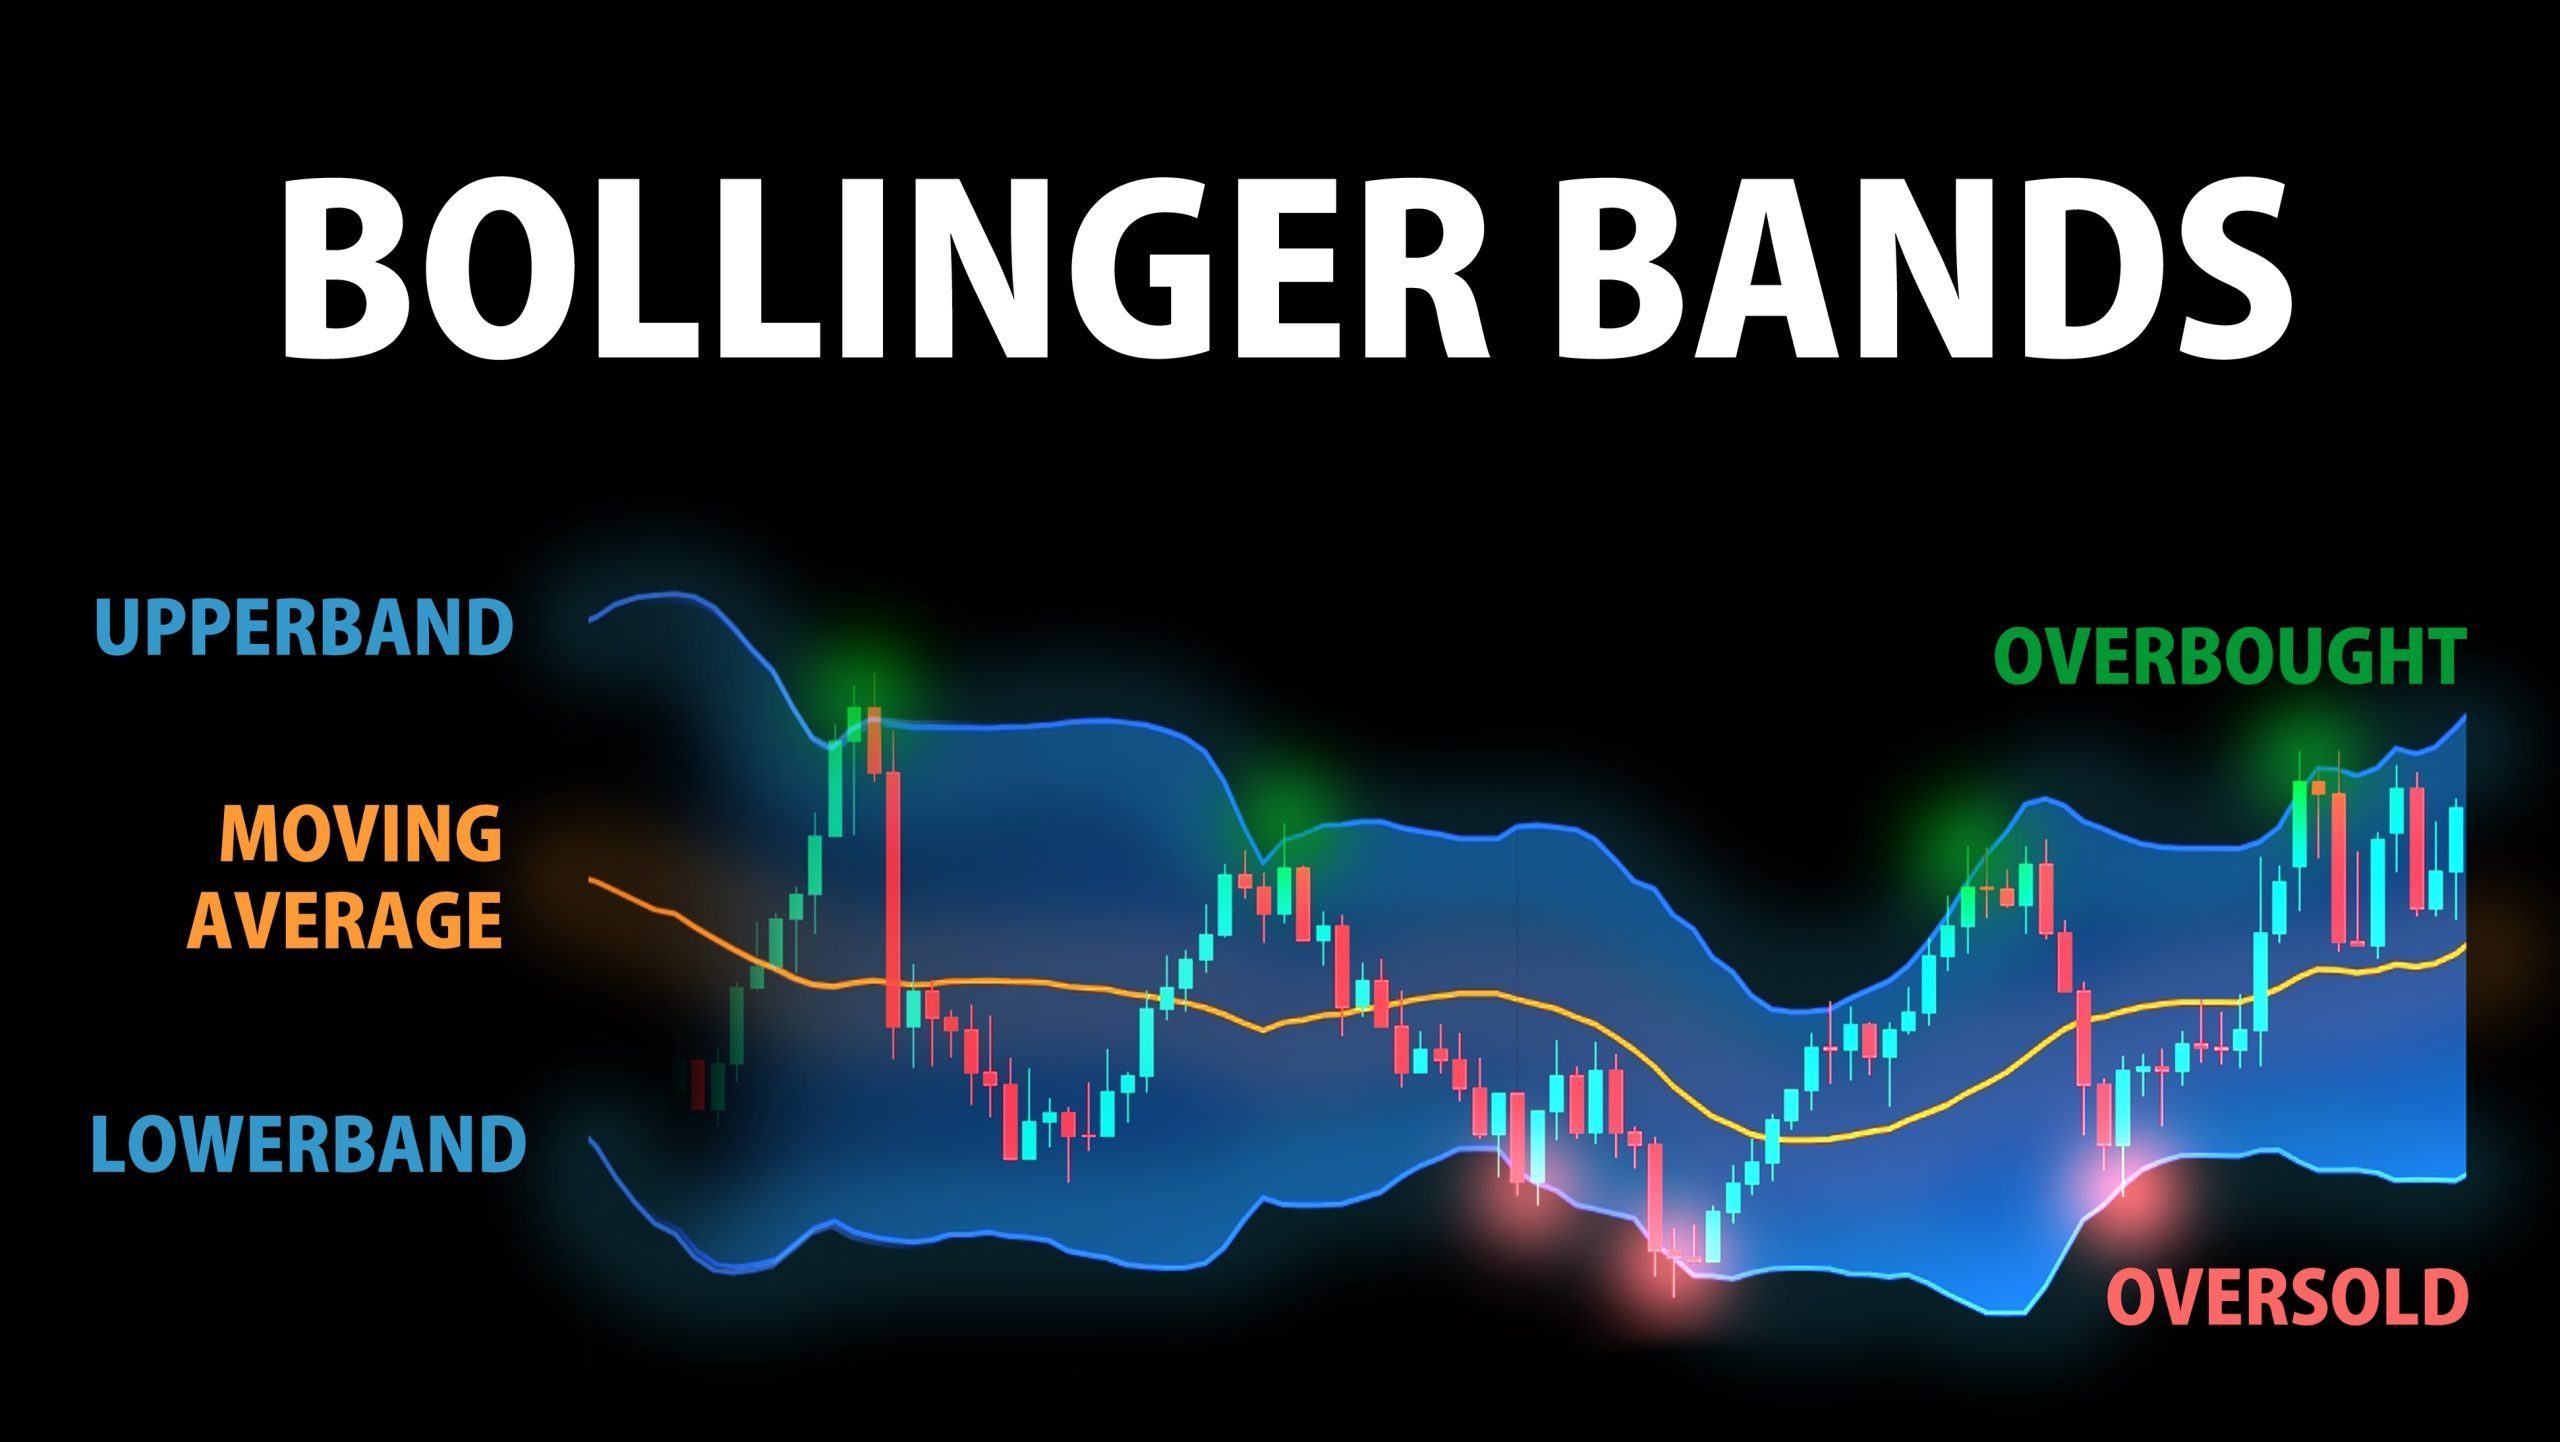
Bollinger Bands are a type of statistical chart characterizing the prices and volatility over time of a financial instrument. They were developed by John Bollinger, a renowned technical trader and chartist. The Bollinger Bands consist of a moving average line, an upper band, and a lower band, which create a ‘channel’ around the price.
History and Development of Bollinger Bands
John Bollinger developed these Bands in the early 1980s while looking for a tool that could provide a relative definition of high and low prices. He noticed that volatility was dynamic, not static as was widely believed at the time. The Bollinger Bands reflect this observation by being flexible to changing market conditions.
Basic Concepts Related to Bollinger Bands
The basic concept behind Bollinger Bands is volatility. These bands widen when the market becomes more volatile and contract during less volatile periods. Thus, the width of the bands is an indicator of market volatility.
Components of Bollinger Bands
Let’s delve deeper into the specific elements that make up Bollinger Bands.
Moving Average
The middle line of the Bollinger Bands is a moving average line, typically a 20-day simple moving average. It represents the intermediate-term trend of the price.
Upper and Lower Bands
On top of and below the moving average are the upper and lower bands. They are plotted two standard deviations away from the moving average, encapsulating the majority of price data.
Relative Positioning of Prices
The relative position of the current price to the bands can give indications about the price being relatively high or low. The basic assumption behind this is that prices tend to stay within the upper and lower band boundaries.
Calculating Bollinger Bands
Formulas involved in Calculation
The calculation of Bollinger Bands may seem complicated at first, but it’s not as daunting as it seems. The upper band is the moving average plus twice the standard deviation, while the lower band is the moving average minus twice the standard deviation.
Importance of Standard Deviation
Standard deviation, a measure of price volatility, plays a vital role here. It provides the basis for the upper and lower Bollinger bands and determines their width. Larger standard deviations result in wider bands when volatility is high.
Setting the Time Period
While the default setting is a 20-period moving average with two standard deviations, you can adjust these parameters to fit your trading needs.
Interpreting Bollinger Bands
Identifying Overbought or Oversold Conditions
When the price reaches the upper band, the asset may be overbought, and a price reversal may be around the corner. Similarly, if the price touches the lower band, it may be oversold, indicating a potential upward move.
Understanding ‘Bollinger Bounce’
The Bollinger Bounce refers to the tendency of prices to bounce back from the lower band to the middle band. This concept relies on the phenomenon that prices tend to revert to the mean.
Understanding ‘Bollinger Squeeze’
The Bollinger Squeeze is a pattern that signals a forthcoming significant move. It occurs when the bands tighten or ‘squeeze,’ indicating low volatility. The end of the squeeze often results in a substantial price move.
Strategies Utilizing Bollinger Bands
Bollinger Bounce Strategy
The Bollinger Bounce strategy uses the Bollinger Bands’ boundaries as entry or exit points. When the price touches the upper band, traders may consider selling or shorting. When it touches the lower band, it could be a buying signal.
Bollinger Squeeze Strategy
As a volatility-based strategy, the Bollinger Squeeze strategy aims to capitalize on price movements after periods of low volatility. Traders typically look for breaks out of the squeeze as potential trading opportunities.
Combination with other Indicators
Bollinger Bands can be used in tandem with other indicators to confirm or refine setups. For instance, traders might use the Relative Strength Index (RSI) together with Bollinger Bands to identify overbought or oversold conditions.
Bollinger Bands in Forex Trading
Using Bollinger Bands to Identify Currency Trends
In the forex market, Bollinger Bands are useful for identifying the start of a trend, its direction, and when it might be reversing. When there is a consistent move towards the upper band, it may indicate an uptrend, while a persistent move towards the lower band signals a downtrend.
Advantages and Disadvantages of Bollinger Bands in Forex
One advantage of Bollinger Bands in forex trading is their versatility. They can be applied to any currency pair and time frame. However, as with all indicators, they are not infallible and should be used as part of a comprehensive trading strategy.
Bollinger Bands in Stock Market
How Traders Use Bollinger Bands to Predict Stock Behavior
Bollinger Bands can help traders identify overbought or oversold levels in the stock market. Additionally, they can spot breakout opportunities when the bands squeeze together.
Effectiveness of Bollinger Bands in Stock Trading
While Bollinger Bands can be highly effective in stock trading, they are not a standalone indicator. They work best when combined with other technical analysis tools, providing greater confidence in trading decisions.
Bollinger Bands in Cryptocurrency Trading
Applying Bollinger Bands in Crypto Trading
Cryptocurrency traders can use Bollinger Bands similarly to traders in other markets. They can signal overbought or oversold conditions and indicate volatility and trend reversals.
Specific Challenges of Using Bollinger Bands in Cryptocurrencies
Cryptocurrency markets can be highly volatile, potentially leading to wider Bollinger Bands and less reliable overbought or oversold signals. Crypto traders must be aware of these factors when creating their trading strategies.
Using Bollinger Bands in Technical Analysis
Comparison with Other Technical Analysis Tools
While Bollinger Bands provide valuable information, other tools such as RSI, Moving Average Convergence Divergence (MACD), and volume indicators provide different perspectives. Good technical analysis often relies on a combination of tools for a more balanced viewpoint.
Integrating Bollinger Bands in a Comprehensive Technical Analysis
Bollinger Bands enhance technical analysis by adding an extra layer of information about volatility and relative price levels. They can help confirm signals from other indicators and can be a key part of a comprehensive technical analysis process.
Advanced Topics in Bollinger Bands
Understanding Bollinger Bandwidth
Bollinger Bandwidth is a related indicator that measures the percentage difference between the upper and lower bands. It provides information about volatility: wider bands imply greater volatility, while narrower bands suggest lower volatility.
Concept of %B (Percent B)
%B, another concept introduced by John Bollinger, quantifies where the price is relative to the Bands. It can help identify overbought or oversold conditions and also signal divergences which might indicate potential reversals.
Use of Multiple Bollinger Bands
Using multiple sets of Bands with different parameters can give a more nuanced view of the price action. For instance, a longer-term set can define the major trend, while a shorter-term set can signal short-term trading opportunities.
In conclusion, while the use and interpretation of Bollinger Bands can initially seem complicated, with time and practice you’ll find they are an invaluable tool in your trading arsenal. Like any other tool, they must be used in conjunction with other indicators and a thorough understanding of the asset and market conditions. Happy Trading!