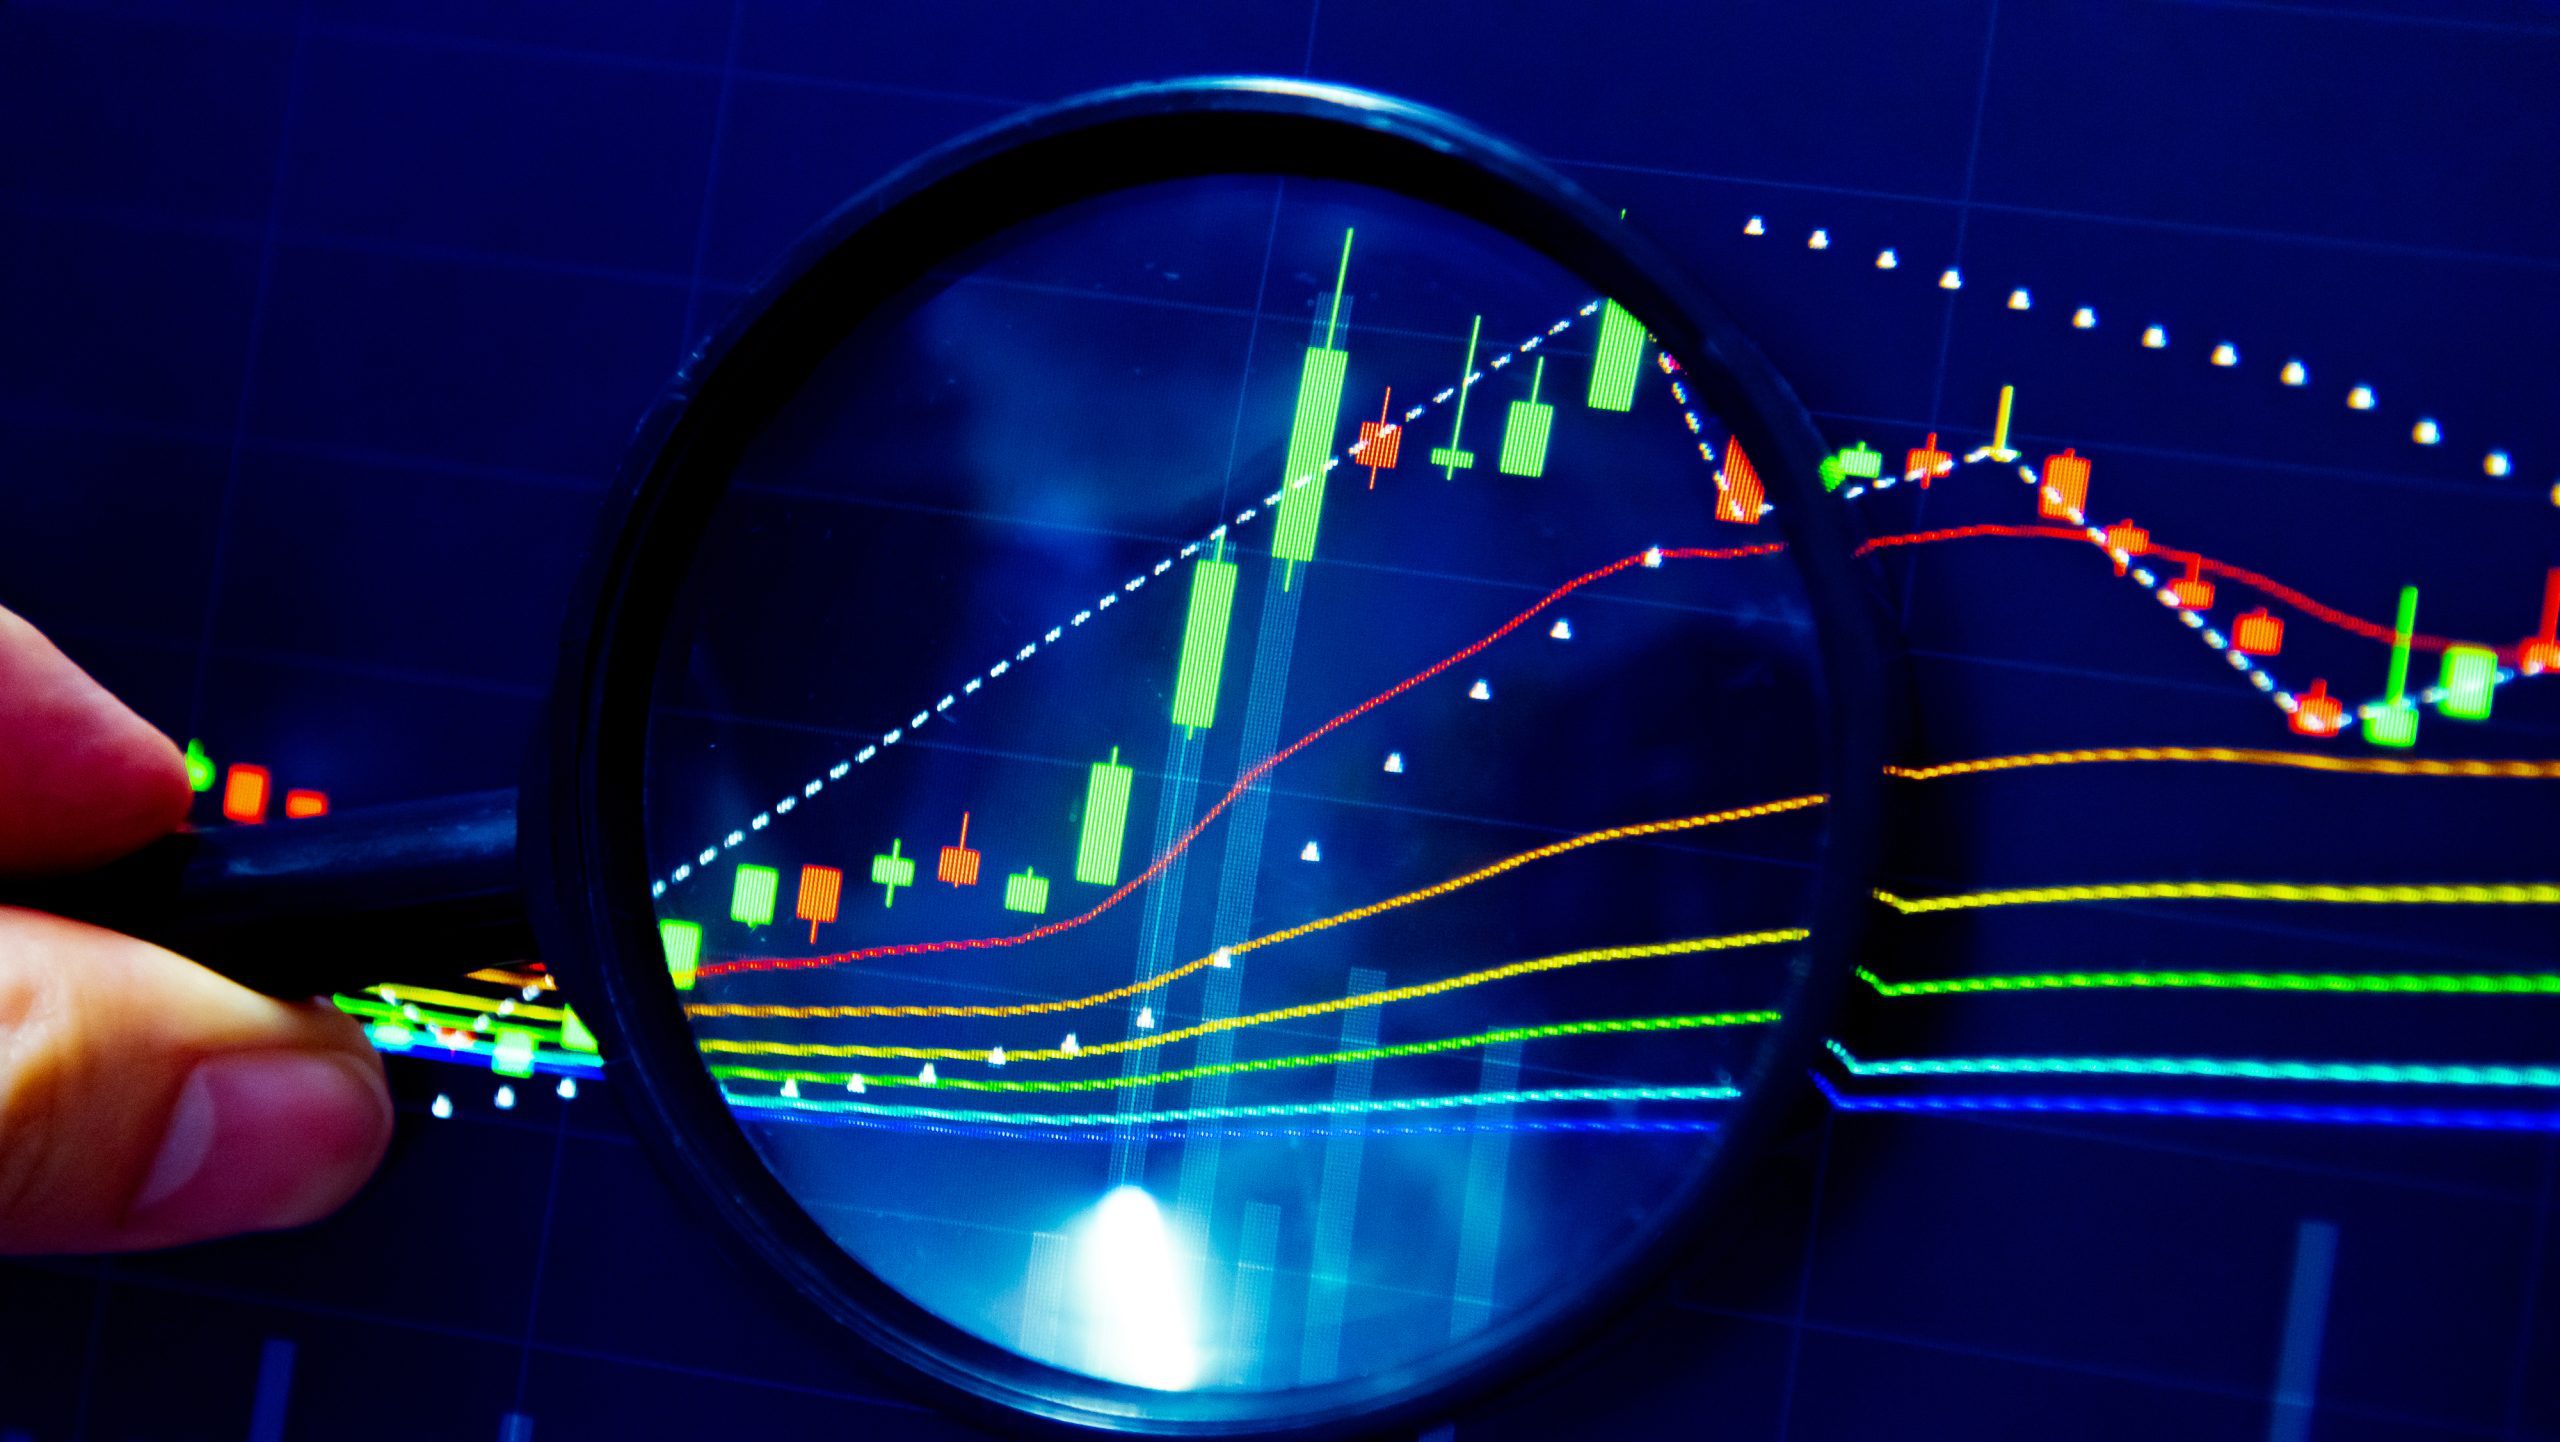
If you’ve ever been curious about how to navigate the world of trading, understanding candlestick patterns is a crucial first step. Candlestick patterns are visual representations of price movements in financial markets, with each candlestick providing valuable insights into market trends and potential price reversals. By learning how to interpret these patterns, you can make more informed trading decisions and potentially increase your chances of success. In this article, we’ll explore what candlestick patterns are and how you can effectively use them to analyze market behavior.

Understanding Candlestick Patterns
Candlestick patterns are a form of technical analysis used by traders to interpret and predict price movements in financial markets. These patterns are formed by the fluctuations in the open, high, low, and close prices of an asset over a given period of time. By observing and analyzing these patterns, traders can gain insights into market sentiment and make more informed trading decisions.
History of Candlestick Patterns
Candlestick patterns have a rich history that dates back to 17th century Japan, where they were first developed and used in the rice market. Originally known as “rice paper” charts, these patterns were later refined and popularized by a Japanese rice trader named Homma Munehisa. His observations and analysis of these patterns formed the basis for what we now know as candlestick patterns.
Importance of Candlestick Patterns
Candlestick patterns are highly regarded by traders for their ability to provide valuable information about price movements and market trends. They offer a visual representation of market data, making it easier for traders to identify potential trading opportunities and determine market sentiment. By understanding and using candlestick patterns effectively, traders can improve their timing of entry and exit points, manage risk more effectively, and enhance their overall trading strategy.
Types of Candlestick Patterns
Candlestick patterns can be categorized into three main types: bullish reversal patterns, bearish reversal patterns, and continuation patterns.
Bullish Reversal Patterns
Bullish reversal patterns indicate a potential trend reversal from bearish to bullish. These patterns typically occur after a downtrend and suggest that buyers are gaining control over sellers. Examples of bullish reversal patterns include the hammer, morning star, and piercing pattern.
Bearish Reversal Patterns
Bearish reversal patterns, on the other hand, signal a potential trend reversal from bullish to bearish. These patterns usually occur after an uptrend and indicate that sellers may be taking control over buyers. Examples of bearish reversal patterns include the evening star, shooting star, and hanging man.
Continuation Patterns
Continuation patterns suggest that the current trend is likely to continue, rather than reverse. These patterns indicate a temporary pause in the market before the trend resumes. Examples of continuation patterns include the doji and engulfing pattern.
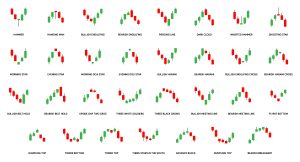
Popular Candlestick Patterns
While there are numerous candlestick patterns, some of the most popular ones include the doji, hammer, engulfing pattern, morning star, evening star, hanging man, piercing pattern, and shooting star.
Doji
The doji is a significant candlestick pattern that represents indecision in the market. It occurs when the opening and closing prices are very close or equal, creating a small or non-existent body with long upper and lower wicks. A doji suggests that the bulls and bears are in a stalemate and can signal a potential trend reversal.
Hammer
The hammer is a bullish reversal pattern that has a small body and a long lower wick. It forms when the price opens near the high, then falls significantly during the trading session but eventually closes near or above the open price. The hammer pattern indicates a potential reversal from a downtrend and is characterized by strong buying pressure.
Engulfing Pattern
The engulfing pattern is a two-candlestick pattern that occurs at the end of a trend. It consists of a smaller candlestick engulfed by a larger candlestick in the opposite direction. A bullish engulfing pattern occurs when a small bearish candlestick is followed by a larger bullish candlestick, indicating a potential trend reversal to the upside. Conversely, a bearish engulfing pattern suggests a potential reversal to the downside.
Morning Star
The morning star is a bullish reversal pattern that consists of three candlesticks. It forms after a downtrend and signifies a potential reversal to the upside. The pattern starts with a long bearish candlestick, followed by a small bearish or bullish candlestick (the “star”) that gaps down, and finally, a long bullish candlestick that closes above the midpoint of the first bearish candlestick.
Evening Star
The evening star is the bearish equivalent of the morning star pattern. It also consists of three candlesticks and occurs after an uptrend. The pattern starts with a long bullish candlestick, followed by a small bearish or bullish candlestick (the “star”) that gaps up, and finally, a long bearish candlestick that closes below the midpoint of the first bullish candlestick.
Hanging Man
The hanging man is a bearish reversal pattern that has a small body and a long lower wick, similar to the hammer pattern. However, the hanging man occurs during an uptrend and indicates a potential reversal to the downside. It suggests that sellers may be coming into the market and overpowering buyers.
Piercing Pattern
The piercing pattern is a bullish reversal pattern that occurs after a downtrend. It consists of two candlesticks, with the first being a bearish candlestick and the second being a bullish candlestick that closes at least halfway above the body of the first candlestick. The piercing pattern suggests that buyers are gaining momentum and could potentially reverse the downtrend.
Shooting Star
The shooting star is a bearish reversal pattern that looks similar to an inverted hammer. It has a small body and a long upper wick, indicating that buyers initially pushed the price up but lost control as sellers entered the market. The shooting star typically occurs at the end of an uptrend and suggests a potential reversal to the downside.
Identifying Candlestick Patterns
To effectively identify candlestick patterns, it is crucial to understand the anatomy of a candlestick and employ pattern recognition techniques and confirmation indicators.
Understanding Candlestick Anatomy
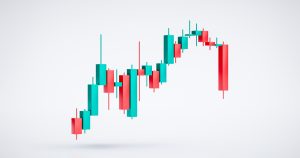
A candlestick is composed of four main parts: the body, upper wick, lower wick, and opening and closing prices. The body represents the price difference between the opening and closing prices, with a filled or colored body indicating a bearish candlestick and an empty or non-colored body indicating a bullish candlestick. The upper wick represents the highest price reached during the period, while the lower wick represents the lowest price.
Pattern Recognition Techniques
Candlestick pattern recognition involves visually identifying specific patterns on a price chart. Traders often rely on their experience and knowledge of these patterns to spot potential trading opportunities. It is important to become familiar with the different candlestick patterns and understand their implications before attempting to recognize them in real-time market conditions.
Confirmation Indicators
Confirmation indicators are additional technical tools or indicators that traders can use to confirm the validity of a candlestick pattern. These indicators may include trendlines, moving averages, oscillators, or volume analysis. By combining candlestick patterns with confirmation indicators, traders can increase their confidence in their trading decisions.
Using Candlestick Patterns for Trading
Candlestick patterns can be a valuable tool for traders when used in conjunction with other forms of analysis. They can help traders determine market sentiment, identify potential entry and exit points, and manage risk effectively.
Determining Market Sentiment
Candlestick patterns provide valuable insights into market sentiment, allowing traders to gauge whether the market is bullish or bearish. By analyzing the patterns and their implications, traders can make more informed decisions on whether to buy or sell an asset.
Entry and Exit Strategies
Candlestick patterns can assist traders in determining optimal entry and exit points for their trades. For example, a bullish reversal pattern such as a hammer or morning star might suggest a good entry point for a long trade, while a bearish reversal pattern like an evening star or shooting star might indicate a good time to exit a long position.
Risk Management Techniques
Risk management is a crucial aspect of trading, and candlestick patterns can aid in this process. By analyzing the patterns and their implications, traders can set appropriate stop-loss levels and take-profit targets. This helps them limit potential losses and maximize potential profits.
Combining Candlestick Patterns with Other Indicators
While candlestick patterns can be powerful on their own, combining them with other technical indicators can enhance their effectiveness and accuracy.
Moving Averages
Moving averages are commonly used to identify trends and provide additional confirmation to candlestick patterns. Traders often use moving average crossovers or the relationship between price and moving averages to validate their trading decisions.
Relative Strength Index (RSI)
The Relative Strength Index (RSI) is a popular momentum oscillator that measures the speed and change of price movements. By combining RSI with candlestick patterns, traders can achieve a stronger understanding of overbought and oversold conditions, ensuring better trade timing.
MACD
The Moving Average Convergence Divergence (MACD) is another widely used indicator for identifying potential trend reversals. When used alongside candlestick patterns, it can provide confirmation of trend changes, strengthening the overall trading decision.
Fibonacci Retracement Levels
Fibonacci retracement levels are used to identify potential support and resistance levels in a market. Traders often combine candlestick patterns with Fibonacci retracement levels to validate potential entry and exit points, as well as to set stop-loss and take-profit levels.
Backtesting Candlestick Patterns
Backtesting is the process of applying a trading strategy to historical market data to evaluate its performance. It is an essential step in understanding the effectiveness of candlestick patterns and can help traders refine their strategies.
Importance of Backtesting
Backtesting allows traders to assess the profitability and reliability of candlestick patterns based on historical data. It helps traders identify the strengths and weaknesses of specific patterns and understand their performance in different market conditions.
Creating a Backtesting Plan
To conduct an effective backtest, traders should define clear entry and exit rules based on the candlestick pattern they wish to test. Historical data should be selected, and the strategy should be applied over a significant period to ensure accurate and reliable results.
Using Backtesting Results to Improve Trading Strategy
Analysis of backtesting results can provide valuable insights into the profitability and success rate of candlestick patterns. Traders can use this information to refine their trading strategies, optimize entry and exit points, and develop effective risk management techniques.
Understanding Limitations of Candlestick Patterns
While candlestick patterns are a valuable tool for traders, it is important to acknowledge their limitations and potential drawbacks.
Probability of False Signals
Candlestick patterns, like any technical analysis tool, are not infallible and can produce false signals. Traders should be aware of this and use additional analysis and confirmation indicators to reduce the risk of false signals.
Market Volatility Impact
Market volatility can affect the accuracy and reliability of candlestick patterns. High volatility can lead to increased noise and false signals, while low volatility may result in fewer trading opportunities. Traders should consider market conditions and adjust their strategies accordingly.
Should Not Be Solely Relied on for Trading Decisions
While candlestick patterns can provide valuable insights, they should not be the sole basis for trading decisions. Traders should consider other forms of analysis, such as fundamental analysis and market sentiment, to have a comprehensive understanding of the market.
Considerations for Using Candlestick Patterns
When using candlestick patterns, traders should consider a few critical factors to enhance their effectiveness and avoid common pitfalls.
Timeframe and Trading Style
Candlestick patterns can work effectively in various timeframes, but it is important for traders to align the timeframe with their trading style and objectives. Short-term traders may prefer lower timeframes, such as intraday charts, while long-term investors may focus on daily or weekly charts.
Pairing Candlestick Patterns with Market Analysis
Candlestick patterns should be used in conjunction with other forms of market analysis, such as technical indicators or fundamental analysis. By combining multiple tools and approaches, traders can form a more comprehensive view of the market and make more informed trading decisions.
Avoiding Overanalysis
While it is essential to conduct thorough analysis, overanalyzing candlestick patterns can lead to confusion and indecision. Traders should focus on the most reliable and widely recognized patterns and avoid getting overwhelmed by excessive analysis.
Learning Resources for Candlestick Patterns
For traders looking to enhance their knowledge and understanding of candlestick patterns, there are several learning resources available.
Books and E-Books
Many books and e-books are dedicated to candlestick patterns and their application in trading. These resources provide in-depth explanations, real-life examples, and practical strategies for utilizing candlestick patterns effectively.
Online Courses and Webinars
Online courses and webinars offer a structured learning environment for traders to deepen their knowledge of candlestick patterns. These courses provide interactive lessons, live trading demonstrations, and opportunities to ask questions and seek guidance from experienced instructors.
Trading Platforms with Candlestick Pattern Tools
Many trading platforms offer built-in tools or plugins that provide automated candlestick pattern recognition. These tools can help traders identify patterns quickly, set up alerts, and make more timely trading decisions.
In conclusion, candlestick patterns are a powerful tool for traders to interpret and predict price movements in financial markets. They offer valuable insights into market sentiment and help traders make more informed trading decisions. By understanding the different types of candlestick patterns, identifying them accurately, and utilizing them in conjunction with other indicators, traders can enhance their trading strategies and improve their overall performance. However, it is important to recognize the limitations of candlestick patterns and use them as part of a comprehensive approach to trading. By continuously learning and refining their knowledge of candlestick patterns, traders can become more proficient in their analysis and achieve greater success in the markets.